
Trying to understand a Dyno graph and the benefits of new cams
#1
 11-16-2011, 01:44 AM


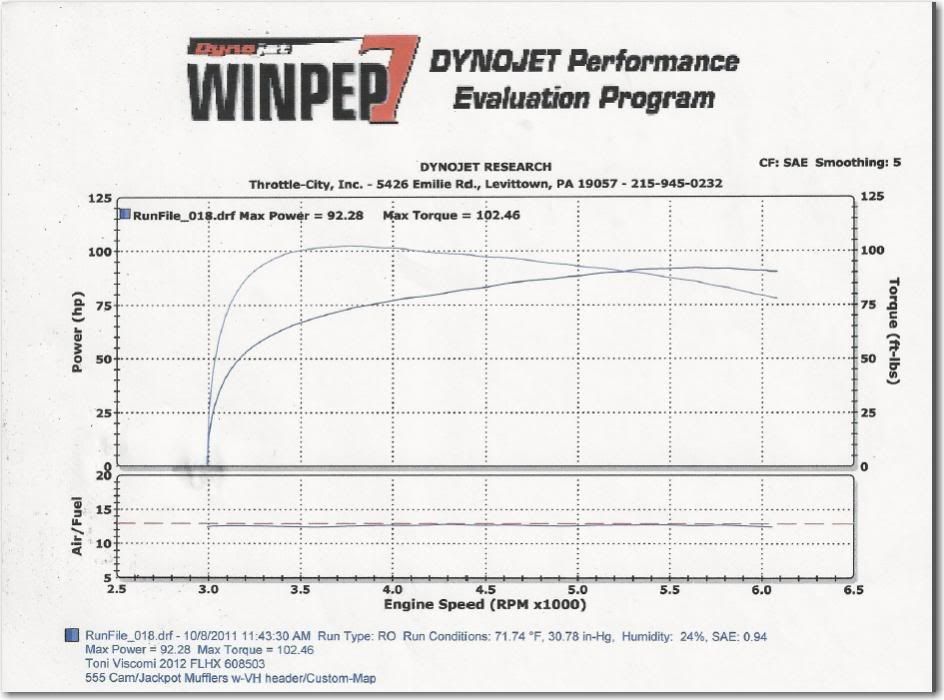
Here is Dyno chart of TW555 cams in a stock 103" motor and we can all agree that it is a very nice gain over stock cams...
However, all I can understand from this graph is whats happening at wide open throttle. Obviously we don't spend all the time riding at wide open throttle... At least I don't
How do we know whats happening at 25% throttle??? and at 50% throttle??? and at 75% throttle??? --> where I spend most of the time...
If I go with these (or similar) cams, am I just paying for increased performance at wide open throttle? In other words, am I actually getting an increase in power at other throttle positions / rpms??? If so, how much???
#2
11-16-2011, 01:51 AM

the throttle position is incidental--- the graphs shows what power is produced at what rpms
for instance to be at 3000 rpm- your throttle may be part open/ part closed--- what ever it is doing, you can see what power is produced at that 3000 rpm...and 4000 etc.
the numbers on the side of the graph represent the power measured by the dyno, both torque and HP.
the scale along the bottom shows the rpm of the motor at the time the power measurements were made.
dyno charts are a great before/after measurement tool- but figures can vary greatly depending on the operator's method of running the bike on the dyno, temperature also affectes the results.
it is possible for unscrupulous vendors to post dyno charts which are jiggered to show their product in the best possible light---
( or advertise a cam before/after when other mods such as pipes and air cleaner and tuning were also done- you'll note the above chart also has aftermarket parts installed as noted)
in extreme cases I have seen charts where the "before" included some component which was designed to work with a second added part for the comparison dyno chart, or a malfuctioning part.----
I cancelled a sub to a magazine years ago after their cover had attributed a 15% HP gain with "magic spark plug wires"--- it was revealed way down in the text that the before chart was with old, cracked plug wires- not plug wires in good shape.
not that I am commenting on this particular chart.
just don't put too much into a chart
cams control when the intake and exhaust vales open and close ( timing) -- how fast they open and close ( ramp), and how much they open and close ( lift)
some cams enhance power within only a small rpm range, and decrease power in other ranges--- most mild cams will increase power substantially over the emissions compliant cams from the factory- power will increase, so will emissions and fuel consumption.
I were selecting cams for myself ( and I have stock cams in my 96", it has plenty power for me, good MPG and tailpipe emissions testing is in place in PHX), I would base my choice on the experience of a reputable performance builder.
The weight and gearing of the bike is big part of selecting the proper cam, look for cams that will not overly stress the valvetrain or cause premature wear or breakdown
mike
Last edited by mkguitar; 11-16-2011 at 03:38 AM.

#4
11-16-2011, 04:37 AM
Ultimate HDF Member
Except that it's not correct.
The above dyno chart is a wide open throttle (WOT) pull. What you're seeing there is what power the engine makes at WOT, nothing else. Depending on throttle opening and intake kPa, you'll make different power at 3000 rpm. IOW, cruising in 6th gear at light throttle to maintain 80 mph, your engine won't be producing the power or torque on your chart.
The above dyno chart is a wide open throttle (WOT) pull. What you're seeing there is what power the engine makes at WOT, nothing else. Depending on throttle opening and intake kPa, you'll make different power at 3000 rpm. IOW, cruising in 6th gear at light throttle to maintain 80 mph, your engine won't be producing the power or torque on your chart.
#5
11-16-2011, 05:58 AM
Outstanding HDF Member
Except that it's not correct.
The above dyno chart is a wide open throttle (WOT) pull. What you're seeing there is what power the engine makes at WOT, nothing else. Depending on throttle opening and intake kPa, you'll make different power at 3000 rpm. IOW, cruising in 6th gear at light throttle to maintain 80 mph, your engine won't be producing the power or torque on your chart.
The above dyno chart is a wide open throttle (WOT) pull. What you're seeing there is what power the engine makes at WOT, nothing else. Depending on throttle opening and intake kPa, you'll make different power at 3000 rpm. IOW, cruising in 6th gear at light throttle to maintain 80 mph, your engine won't be producing the power or torque on your chart.
It's amazing how many people think their dyno sheet is showing what their bike runs at all TP's. We had a group of guys come in on their crotch rockets to an event we had this summer, we were doing dyno pulls and one of the guys had me run his bike, when I was done they were all looking over his sheet and the one guy was saying how rich he was in his cruising range and how he needed to lean it out a bit there. When I tried to explain to this guys that nowhere on the sheet showed his cruising AF he got all defensive (out of embarrasment because he was the "tuner" in his little group of friends). He told me that metric bikes don't tune like Harleys, that's why he could tell the cruising from the print out. I seriously had to laugh my *** off. It had a Power Commander on it and I tune them all the time.
To the OP, I would say that if your tuner got the rest of your throttle position ranges as close to what he did in the 100% range that you have a pretty nice tune. The sheet is showing a pretty nice air fuel line. The bike makes excellent power in the low RPM's (although it's strange to see a run start at 3000, usually they start at 2000 RPM's). Cruising is usually in the 10 - 25% throttle positions, the sheet shows me that if you are cruising at say 15% throttle, and you want to pass someone you can just twist the wick and go. You could go back to your tuner and have him give you a printout for the lower RPM ranges.
#7
11-16-2011, 06:23 AM
Trending Topics
#8
11-16-2011, 07:26 PM
the throttle position is incidental--- the graphs shows what power is produced at what rpms
for instance to be at 3000 rpm- your throttle may be part open/ part closed--- what ever it is doing, you can see what power is produced at that 3000 rpm...and 4000 etc.
the numbers on the side of the graph represent the power measured by the dyno, both torque and HP.
the scale along the bottom shows the rpm of the motor at the time the power measurements were made.
dyno charts are a great before/after measurement tool- but figures can vary greatly depending on the operator's method of running the bike on the dyno, temperature also affectes the results.
it is possible for unscrupulous vendors to post dyno charts which are jiggered to show their product in the best possible light---
( or advertise a cam before/after when other mods such as pipes and air cleaner and tuning were also done- you'll note the above chart also has aftermarket parts installed as noted)
in extreme cases I have seen charts where the "before" included some component which was designed to work with a second added part for the comparison dyno chart, or a malfuctioning part.----
I cancelled a sub to a magazine years ago after their cover had attributed a 15% HP gain with "magic spark plug wires"--- it was revealed way down in the text that the before chart was with old, cracked plug wires- not plug wires in good shape.
not that I am commenting on this particular chart.
just don't put too much into a chart
cams control when the intake and exhaust vales open and close ( timing) -- how fast they open and close ( ramp), and how much they open and close ( lift)
some cams enhance power within only a small rpm range, and decrease power in other ranges--- most mild cams will increase power substantially over the emissions compliant cams from the factory- power will increase, so will emissions and fuel consumption.
I were selecting cams for myself ( and I have stock cams in my 96", it has plenty power for me, good MPG and tailpipe emissions testing is in place in PHX), I would base my choice on the experience of a reputable performance builder.
The weight and gearing of the bike is big part of selecting the proper cam, look for cams that will not overly stress the valvetrain or cause premature wear or breakdown
mike
for instance to be at 3000 rpm- your throttle may be part open/ part closed--- what ever it is doing, you can see what power is produced at that 3000 rpm...and 4000 etc.
the numbers on the side of the graph represent the power measured by the dyno, both torque and HP.
the scale along the bottom shows the rpm of the motor at the time the power measurements were made.
dyno charts are a great before/after measurement tool- but figures can vary greatly depending on the operator's method of running the bike on the dyno, temperature also affectes the results.
it is possible for unscrupulous vendors to post dyno charts which are jiggered to show their product in the best possible light---
( or advertise a cam before/after when other mods such as pipes and air cleaner and tuning were also done- you'll note the above chart also has aftermarket parts installed as noted)
in extreme cases I have seen charts where the "before" included some component which was designed to work with a second added part for the comparison dyno chart, or a malfuctioning part.----
I cancelled a sub to a magazine years ago after their cover had attributed a 15% HP gain with "magic spark plug wires"--- it was revealed way down in the text that the before chart was with old, cracked plug wires- not plug wires in good shape.
not that I am commenting on this particular chart.
just don't put too much into a chart
cams control when the intake and exhaust vales open and close ( timing) -- how fast they open and close ( ramp), and how much they open and close ( lift)
some cams enhance power within only a small rpm range, and decrease power in other ranges--- most mild cams will increase power substantially over the emissions compliant cams from the factory- power will increase, so will emissions and fuel consumption.
I were selecting cams for myself ( and I have stock cams in my 96", it has plenty power for me, good MPG and tailpipe emissions testing is in place in PHX), I would base my choice on the experience of a reputable performance builder.
The weight and gearing of the bike is big part of selecting the proper cam, look for cams that will not overly stress the valvetrain or cause premature wear or breakdown
mike
#9
11-16-2011, 08:24 PM
Road Warrior
#10
11-16-2011, 08:32 PM
Also take into consideration the "peaks" of the graph. In the ideal world you would want an engine that made a "flat curve" thereby maximizing the area underneath it. i.e. if you have a cam that comes on @ 2000rpm that makes a relativly flat curve to say 5000 rpm at say 85hp and 95lb/ft versus a cam that comes on @ 3500 rpm to 6000 and is very peaky making top power in a sharp rise as it goes to say 5000rpm of say 100hp 110 lb ft but at 4000 rpm that power is 75hp and 80 lb.ft this causes there to be less area under the curve than the lower power cam and in MOST situations the lower powered bike would win a stoplight race. Now in all out drag or a roll on you would see the higher power band and peakier curve prevail. It's easier to explain with a bunch of graphs but I've had one too many Crowns to be that smart tonight..